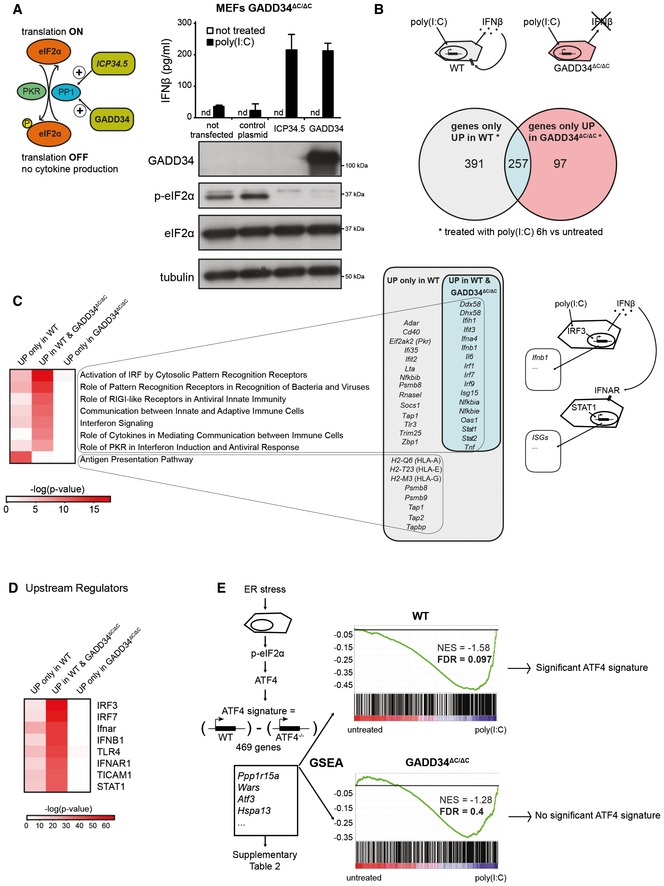
Figure 1. Comparative transcriptional analysis of WT and GADD34ΔC/ΔC MEFs responding to poly(I:C).

- Left: Graphical abstract of GADD34 and herpes simplex viral protein ICP34.5 effects on translation initiation. ICP34.5 mimics PP1 cofactor GADD34 activity and contributes to dephosphorylation of eIF2α. As a result, the translation inhibition mediated by eIF2α kinases such as PKR is relieved. Right: GADD34ΔC/ΔC MEFs were transfected with the indicated plasmid constructs 24 h before HMW poly(I:C) delivery. After 6 h of treatment, culture supernatants were collected and IFN‐β production was measured by ELISA (mean ± SD of three independent experiments). Representative detection of GADD34, eIF2α, and p‐eIF2α by immunoblot in the lysate of the same group of cells. Tubulin is used as a loading control. “nd” stands for “not detected”.
- Top: Schematic representation of WT cells treated with poly(I:C) and producing IFN‐β. This cytokine triggers specific signaling via IFNAR receptor in an autocrine or paracrine manner, whereas GADD34ΔC/ΔC MEFs do not produce IFN‐β. Bottom: Venn diagram representation of statistically upregulated genes in WT and GADD34ΔC/ΔC MEFs after 6 h of HMW poly(I:C) treatment. The complete sets of genes are detailed in Appendix Table S1.
- Heat maps of selected pathways found enriched by ingenuity pathway analysis (IPA) for the DEGs depicted in Venn diagrams. Selected genes belonging at least to one of the IPA pathways are shown and grouped according to their expression specificity. Right: Schematic representation of poly(I:C)‐treated cells showing IRF3‐dependent induction of genes, like IFN‐β, and the concomitant induction in neighboring cells of IFN‐stimulated genes (ISGs) after IFNAR stimulation.
- Heat‐map representation of selected putative upstream regulators found enriched by IPA for the different DEGs sets.
- Gene set enrichment analyses (GSEAs) of a defined ATF4 gene expression regulated signature (Appendix Table S2), on the pairwise comparisons of WT MEFs untreated vs poly(I:C) (left panel) and GADD34ΔC/ΔC MEFs untreated vs poly(I:C) (right panel). The more the ATF4 regulated signature gene set is differentially expressed between conditions, the more the bar code is shifted to the corresponding extremity. NES: normalized enrichment score; FDR: false discovery rate.
