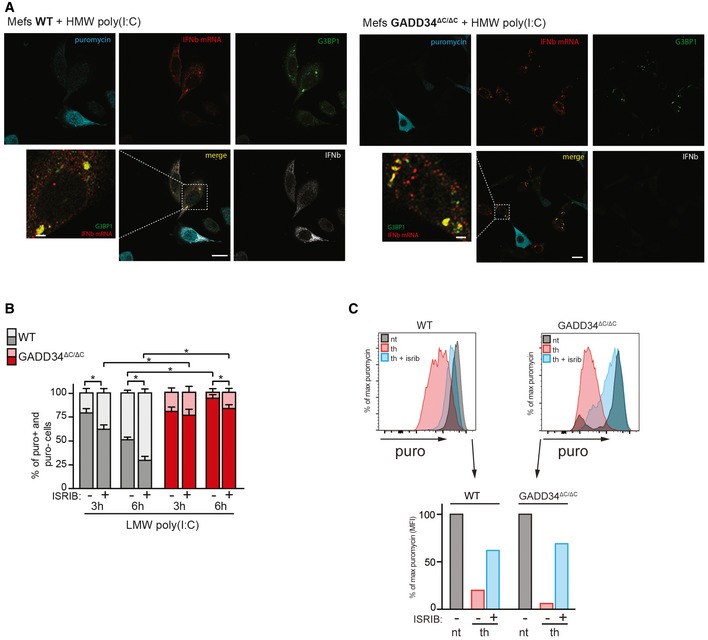
Figure EV2. Level of total translation, IFN production and IFN mRNA in WT and KO upon dsRNA stimulation.

- Fluorescence in situ hybridization (FISH) for IFNB mRNA, combined with immunofluorescence staining for protein synthesis (with an anti‐puromycin mAb), for stress granules (with anti‐G3BP1 Ab) and for IFN‐β protein in WT and GADD34ΔC/ΔC MEFs stimulated with HMW poly(I:C) for 6 h and labeled with puromycin for 10 min. Scale bars = 10 μm.
- WT and GADD34ΔC/ΔC MEFs were stimulated with LMW poly(I:C) for indicated times in the presence of ISRIB and puromycin for protein synthesis measurement by FACS. Percentiles of translating (puro+, light color) and non‐translating cells (puro−, dark color) were determined by flow cytometry from fluorescence intensity of individual cells and are represented as cumulative bars for WT (gray) and GADD34ΔC/ΔC MEFs (red). P‐values were calculated using a Student's t‐test, *P < 0.05. Mean ± SD.
- Similar experiments were conducted with thapsigargin and ISRIB. In UPR conditions, ISRIB rescued protein synthesis efficiently, confirming the efficacy of the drug on this pathway. Although ISRIB abrogates the impact of eIF2α phosphorylation on translation initiation during ER stress, it does not efficiently restore protein synthesis and cytokines production in cells responding to dsRNA.
