-
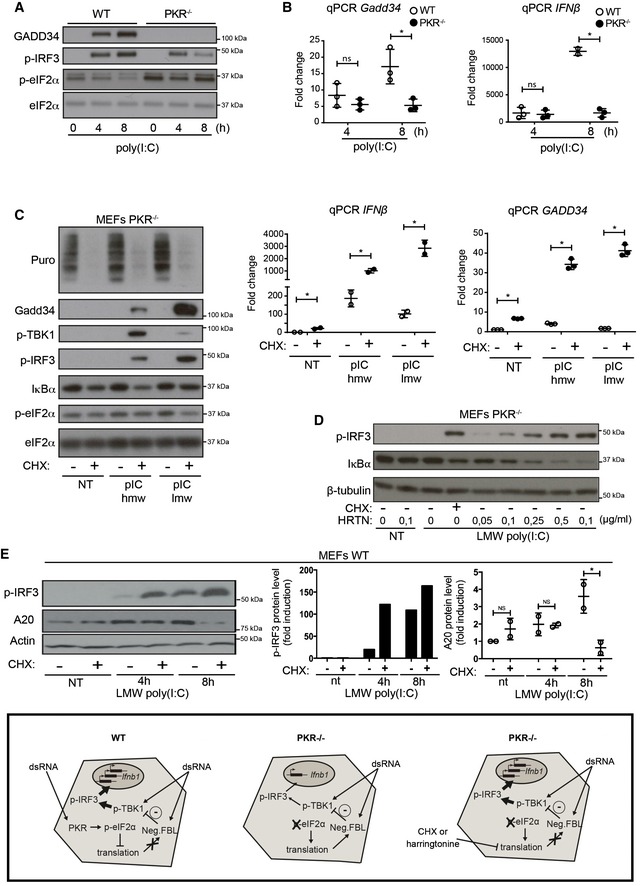
A, B
WT and PKR−/− MEFs were stimulated with HMW poly(I:C) for 4 h and 8 h. (A) GADD34, p‐IRF3, and p‐eIF2α/eIF2α were detected by immunoblot. (B) GADD34 and IFNB mRNA expression were determined by qPCR in WT and PKR−/− MEFs. Results are the mean ± SD of three independent experiments.
-
C
PKR−/− MEFs were treated or not with 5 μg/ml of cycloheximide (CHX), together with poly(I:C) for 8 h. Protein synthesis was monitored using puromycin labeling followed by immunoblot with an anti‐puromycin mAb. Expression of the indicated proteins was determined by immunoblot (left). GADD34 and IFNB mRNA levels were quantified by qPCR (right). Data are representative of three independent experiments. Results are the mean ± SD of three independent experiments.
-
D
PKR−/− MEFs were treated or not with the indicated concentration of harringtonine, before monitoring p‐IRF3 levels and IκBα expression by immunoblot after 8 h of dsRNA exposure. Non‐treated (nt, control without poly(I:C)) and CHX treatment were used as negative and positive references. Tubulin is shown as a loading control.
-
E
WT MEFs were treated with LMW poly(I:C) for the indicated time before monitoring p‐IRF3 levels and A20 level by immunoblot (left panel). P‐IRF3 (middle) and A20 protein levels (right) were quantified by ImageJ quantification. Graphs represent data normalized to non‐treated samples, n = 2. A schematic representation of the experimental design and corresponding results is boxed at the bottom of the figure. Results are the mean ± SD of three independent experiments.
Data information: (B, D, E)
P‐values were calculated using a Student's
t‐test, *
P <
0.05.
Source data are available online for this figure.

