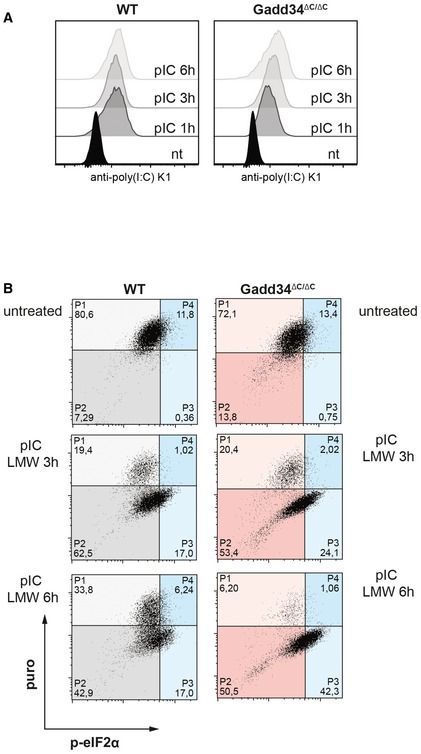
Figure EV3. Levels of intracellular poly(I:C) uptake and eIF2α phosphorylation in WT and GADD34ΔC/ΔC MEFs.

- WT and GADD34ΔC/ΔC MEFs were treated with poly(I:C) for 1, 3, and 6 h before fixation and permeabilization. Poly(I:C) was detected with specific K1 mAb using intracellular flow cytometry.
- Two‐dimensional plots of fluorescence intensity of individual WT (grey and blue) and GADD34ΔC/ΔC MEFs (red and blue) stained for puromycin (y‐axis) and p‐eIF2α (x‐axis). Percentage of cells in each quadrant is indicated. Cells expressing p‐eIF2α are shifted in the two right quadrants (P3 and P4, blue).
