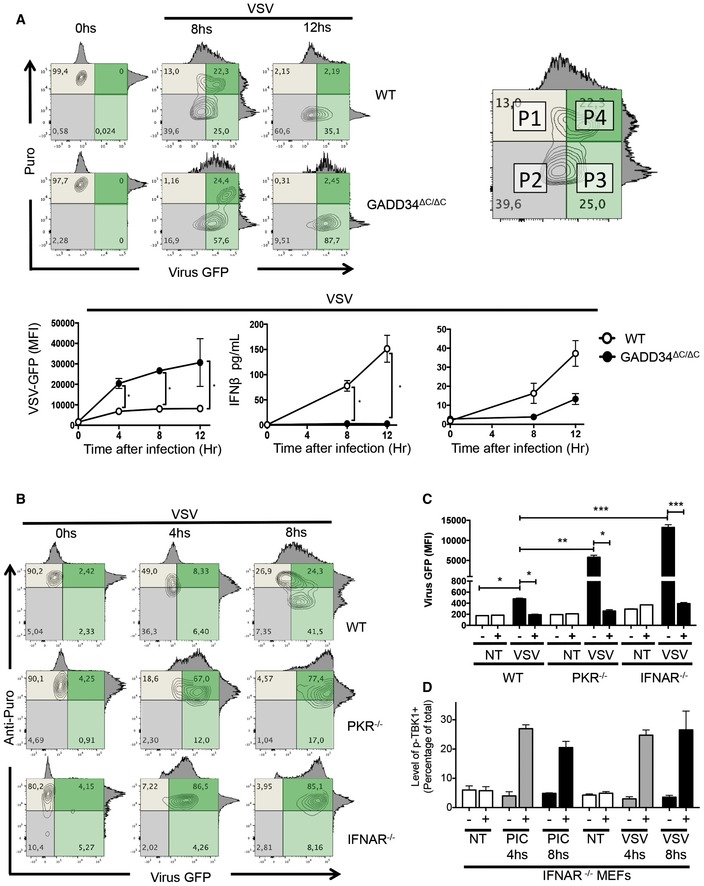
WT and Gadd34ΔC/ΔC MEFs were inoculated with VSV‐GFP for the indicated time points. As depicted in the contour plots, the level of total translation (puromycin incorporation, Puro y‐axis, gray) and viral GFP expression (x‐axis, green)) were measured using anti‐puromycin staining and flow cytometry. An example of how flow quadrants (P1–P4) are labeled is shown (right). The kinetics of VSV‐GFP expression (GFP MFI) in WT and Gadd34ΔC/ΔC MEFs is shown (lower left panel). Induction of GADD34 measured by FACS and concentration of IFN‐β in the supernatant of VSV‐infected WT, and Gadd34ΔC/ΔC MEFs are shown in the lower panel.
WT, PKR−/−, and IFNAR1−/− MEFs were inoculated with VSV‐GFP (green) for 4–8 h prior to being subjected to puromycin incorporation and anti‐puromycin staining (gray) for flow cytometry analysis.
WT, PKR−/−, and IFNAR1−/− MEFs were inoculated with VSV‐GFP in the presence or absence of 5 μg/ml of cycloheximide (CHX) and viral GFP levels were measured by flow cytometry after 8 h of treatment.
IFNAR1−/− MEFs were inoculated with VSV‐GFP or lipofected with poly(I:C) for the indicated time in the presence or absence of CHX. Cells were collected and stained with anti‐pTBK1 and quantified by flow cytometry.
Data information: Data represent mean ± SD. (A, C) *, **, and *** represent
P < 0.05, < 0.01, and < 0.001, respectively (
n ≥ 2).
t‐tests with Holm–Sidak correction.

