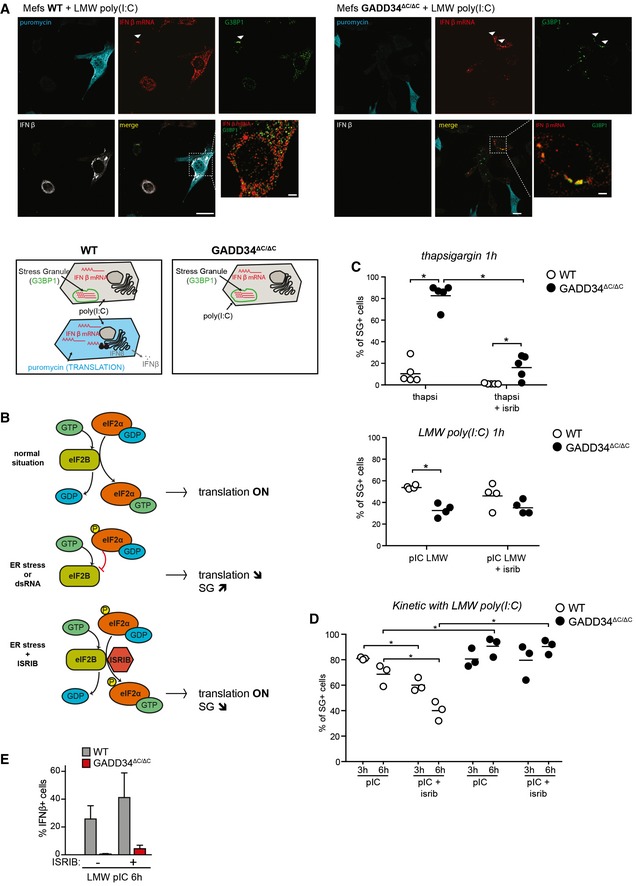
Figure 5. Stress granules formed during response to poly(I:C) contain IFNB mRNAs and are resistant to ISRIB.

- Fluorescence in situ hybridization (FISH) staining for IFNB mRNA, combined with immunofluorescence confocal microscopy to detect protein translation (puromycin), stress granules (G3BP1), and IFN‐β protein in WT and GADD34ΔC/ΔC MEFs stimulated with LMW poly(I:C) for 6 h and labeled with puromycin for 10 min. Scale bars = 10 μm. Examples of colocalization between IFNB mRNA and G3BP1 in stress granules are indicated by arrowheads. Schematic representation of the different situations observed in both cell lines is shown below.
- Graphical abstract of the mechanism of action of ISR inhibitor (ISRIB). The small molecule ISRIB is able to prevent the dominant negative effects of p‐eIF2α on the guanine exchange factor (GEF) activity of eIF2B in cells undergoing ER stress. ISRIB facilitates therefore translation initiation even in the presence of large amounts of p‐eIF2α and is able to reverse the effects of a stress response such as translation decrease or stress granule formation.
- Percentages of SG‐containing cells within the total cell population were determined using software‐assisted quantification (see Appendix Supplementary Materials and Methods for details) from immunofluorescence mosaic images of WT and GADD34ΔC/ΔC MEFs stimulated with thapsigargin (left panel) or LMW poly(I:C) (right panel) for 1 h. When indicated, ISRIB was added to the cells at the time of stimulation. Each plot corresponds to one replicate out of five (left) or four (right) independent experiments. Means are represented with bars. The total number of counted cells in each replicate was comprised between 500 and 1,500. P‐values were calculated using a Student's t‐test, *P < 0.05.
- Same as (C) except that MEFs were stimulated with LMW poly(I:C) for 3 h or 6 h.
- Percentile of IFN‐β‐producing cells determined by flow cytometry. The results are the mean ± SD of four independent experiments. ISRIB has little impact on the protein synthesis inhibition triggered by dsRNA stimulation of PKR.
