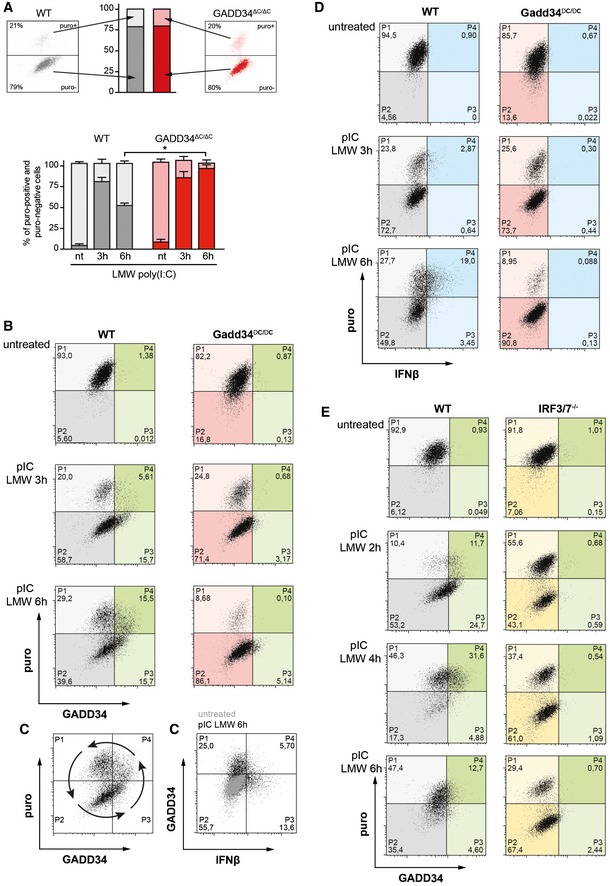
Different matching control and gene‐inactivated MEFs were stimulated with LMW poly(I:C) for indicated times or left untreated, followed by puromycin labeling and intracellular detection with anti‐puromycin, anti‐GADD34, and anti‐IFN‐β antibodies and quantification by flow cytometry. Results shown in panels (B–D) are coming from a representative experiment out of four.
Two‐dimensional plots of fluorescence intensity of individual WT (left panel, grey) and GADD34ΔC/ΔC MEFs (right panel, red) stimulated with poly(I:C) for 3 h prior to staining for puromycin (y‐axis) and GADD34 (x‐axis). The percentiles of translating (puro+, light color) and non‐translating cells (puro−, dark color) were determined from the plots of fluorescence intensity of individual cells and are represented as cumulative bars for WT (grey) and GADD34ΔC/ΔC MEFs (red). Mean ± SD of four independent experiments is shown for not treated 0 h (nt), and 3 and 6 h poly(I:C)‐treated MEFs. P‐values were calculated using a Student's t‐test, *P < 0.05. Translation recovery at 6 h is around 50% of WT cells and hardly occurs in GADD34ΔC/ΔC cells.
Two‐dimensional plots of fluorescence intensity of individual WT (left panels, gray and green) and GADD34ΔC/ΔC MEFs (right panels, red and green) stimulated with poly(I:C) for 0, 3, 6 h prior to staining for puromycin (y‐axis) and GADD34 (x‐axis). Translating cells are detected in the two upper quadrants (P1 and P4), cells in which protein synthesis is inhibited are in the two lower quadrants (P2 and P3), and cells expressing GADD34 are shifted in the two right quadrants (P3 and P4, green). The progression over time of the dsRNA‐stimulated cells through the different quadrants suggests a cycle and potentially, an oscillation of protein synthesis and IFN‐β production.
Same as (B) with GADD34 staining on the y‐axis and IFN‐β on the x‐axis. Cells that produce IFN‐β rarely express the GADD34 protein, despite a common transcriptional regulation. This indicates that full translation recovery is necessary for IFN‐β production, a situation that is likely promoting a rapid GADD34 loss.
Same experiment as in (B) but cells expressing IFN‐β are in the two right quadrants (blue). IFN‐β production only occurs in the cells that are active in protein synthesis.
Two‐dimensional plots of fluorescence intensity of WT (left panels) and IRF3/IRF7−/− MEFs (right panels) stimulated with poly(I:C) for 0, 2, 4, and 6 h prior to staining for puromycin (y‐axis) and GADD34 (x‐axis). IRFs are necessary for GADD34 expression and their inactivation renders cell incapable of restoring protein synthesis after dsRNA‐induced inhibition. Interestingly, in this set of control MEFs, a rapid cycle of translation arrest, restoration, and again arrest can be observed during the 6 h of the experiment, matching the synthesis of GADD34.

