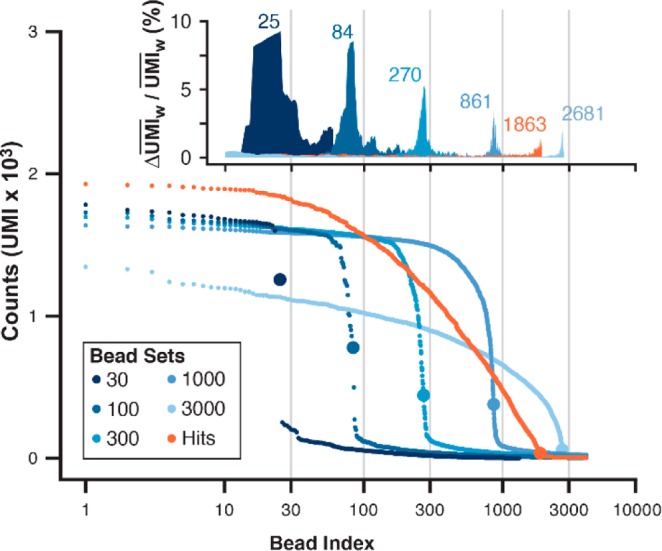
Figure 5.

Hit bead collection quantitation by sequence analysis. Standards of positive control pepstatin A beads 1 were prepared by FACS in known lot sizes (30, 100, 300, 1000, 3000; blue hues). The DNA encoding tags of standard lots and the hit bead collection were each amplified in bulk and sequenced. Sequencing coverage for the hit bead collection and 3000-bead lot were 6-fold lower than other standard lots (30, 100, 300, 1000). Reads were aligned to a degenerate reference sequence, edited for single-base errors, aggregated by sequence, and counted by the N8 UMI after enforcing a Hamming distance of >1 per UMI. (A) Unique encoding sequences were rank ordered and plotted by UMI counts (bead index). Each plot contained an inflection (large data point) as the bead index approached the known lot size. (B) A normal weighted average UMI value (UMIw) was generated for each bead index, and the inflection point for each curve was approximated at the bead index yielding a maximum ΔUMIw/UMIw (% change in UMI; inset). The inflection x coordinate is the bead index cutoff (25, 84, 270, 861, 1863, 2681).
