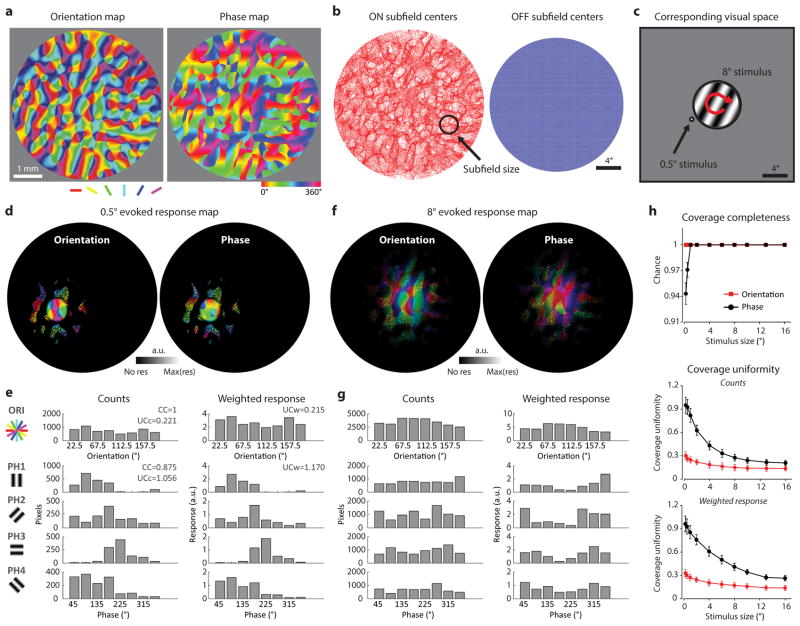
Extended Data Figure 8. Simulation based on experimental observations to evaluate completeness and uniformity of coverage for orientation and phase representations.
a, The large scale orientation preference map derived from intrinsic signal imaging and corresponding phase map predicted from experimental observations (see Methods). b, Distribution of ON and OFF subfield centers in visual space predicted from the visuotopic precision and orientation specific displacement demonstrated in this study. Although the distribution of the ON subfield centers in visual space appears uneven, complete coverage of visual space is achieved when the actual size of the ON subfields is considered. c, Illustration of two of the visual stimuli (8 degree stimulus in the center, 0.5 degree stimulus to the left) used to simulate the evoked response map. d, Theoretical stimulus evoked orientation and phase response maps for sample 0.5° stimulus shown in c (see Methods). e, Histograms showing the distribution of preferred orientation and phase values for pixels activated in d, calculated by counts of the pixels in the responsive region (left) or weighted by the strength of the responses (right). f, Theoretical stimulus evoked orientation and phase response maps for sample 8° stimulus shown in c (see Methods). g, Histograms showing the distribution of preferred orientation and phase values for pixels activated in f, calculated by counts of the pixels in the responsive region (left) or weighted by the strength of the responses (right). h, Completeness (top) and uniformity (middle, bottom) of coverage simulated with visual stimuli of various sizes and positions. Complete coverage can be achieved with stimuli of 1 degree, while coverage uniformity continues to improve with increases in stimulus size. The results of spatial phase were always the average results obtained with four different orientations. Error bars indicate s.e.m.

