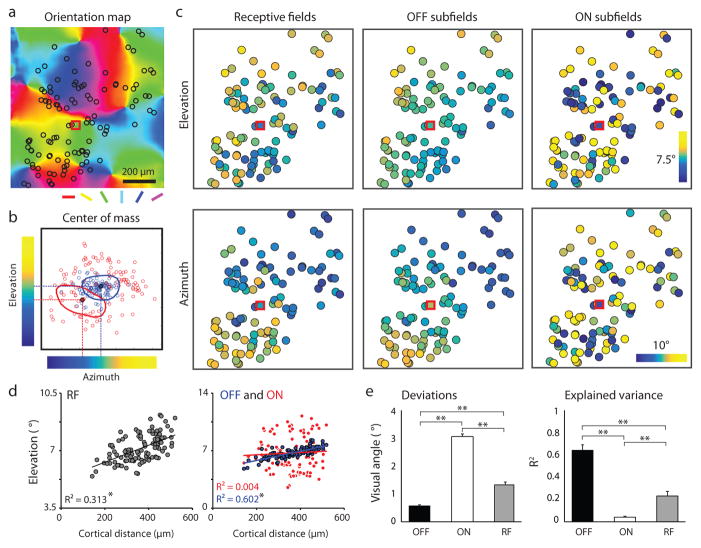
Figure 2. Differences in visuotopic precision of simple cell ON and OFF subfield centers.
a, Example field of view showing somatic location of all simple cells from four cortical depths (black circles) superimposed on the orientation map. b, The location in visual space of the center of mass of ON and OFF subfields for neurons in a illustrating the color code that is used to depict azimuth and elevation values in c. RF of an example cell (red square in a and c) showing translation of ON and OFF subfield centers into elevation-azimuth coordinates. c, The visual field location (elevation and azimuth) for the receptive field and ON/OFF subfields for each neuron illustrated in a. d, The relation between cortical distance (along the elevation axis) and elevation in visual space for the receptive fields (left) and the ON and OFF subfields (right) from the example in c. (linear regression, *P < 0.0001). e, The summary showing the deviations of the experimental data from smooth visuotopy (left) and the degree to which a smooth visuotopy accounts for the variance in the experimental data (right) (Kruskal-Wallis test with post hoc using Dunn’s method, N = 16 visuotopic maps, combining elevation and azimuth results from 8 imaging areas, **P < 0.0001; see Methods). Error bars indicate s.e.m.

