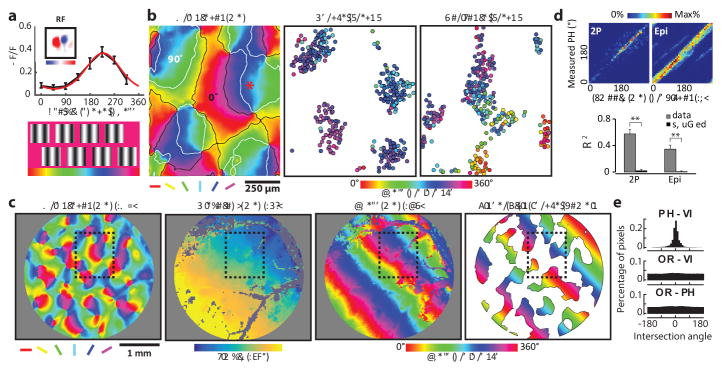
Figure 4. Smooth progression of absolute spatial phase across orientation domains.
a, The phase tuning curve (black) and its Gaussian fit (red) for an example neuron derived from 8 static grating stimuli. b, Organization of the phase preference for populations of neurons derived with vertical and horizontal grating stimuli visualized with two-photon imaging at three cortical depths. Cortical domains with a significant response to vertical and horizontal gratings are delineated by contours (white and black respectively). Neighboring neurons exhibit similar phase preferences, and the preferences shift in a progressive fashion across the orientation domains. c, Epi-fluorescence imaging demonstrates relation of phase map derived with vertical grating to maps of orientation and visual space (azimuth). Black rectangle indicates the 2-P field of view shown in b. The smooth progression of preferred phase along the visuotopic axis orthogonal to the stimulus orientation is evident at this scale. The rightmost figure shows a linear fit of the phase signal within vertical orientation domains to approximate the phase preference map. d, Both for the two-photon and epi-fluorescence data, a smooth phase progression generated with a linear fit was used to test for correlation with the experimental data (circular regression, both P < 0.0001). The smooth progression accounted for a greater amount of the variance in the experimental data compared to shuffled data (**p < 0.0001, rank-sum test within group; see Methods). Error bars indicate s.e.m. e, The intersection of the phase and visuotopic map gradients shown in c peaks around 0 degree (0.32° in this case and −0.08° on average of six maps), indicating a parallel relationship (P = 5.2 × 10⁻¹⁶, Rayleigh test), while there is no significant non-uniformity for the intersection of orientation map gradients with either phase or visuotopic map gradients (P > 0.05, Rayleigh test).

