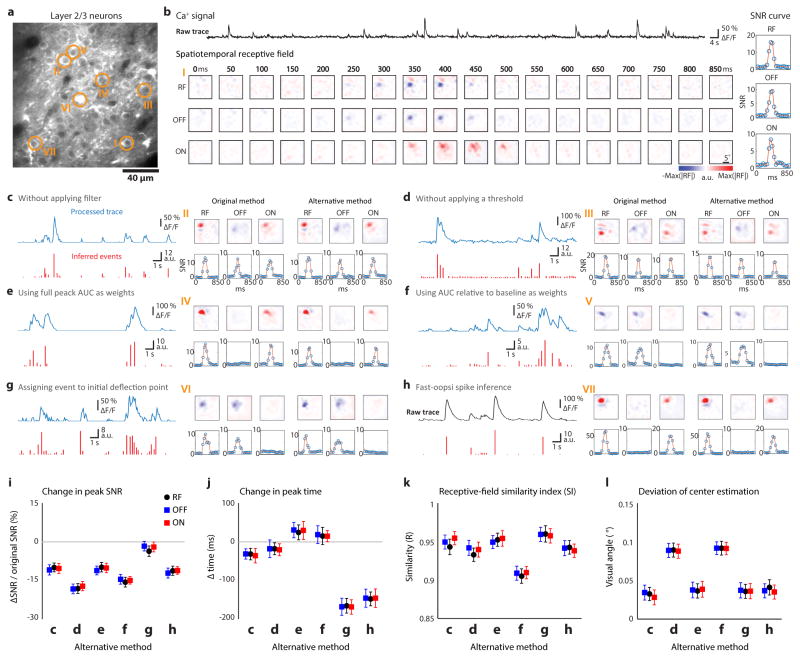
Extended Data Figure 1. Robust receptive field estimation from GCaMP6 calcium signal in layer 2/3 neurons.
a, Somatic location of seven example cells (circle) overlaid on the two-photon field of view. b, Raw calcium trace, spatiotemporal receptive field and signal-noise ratio (SNR) curve from an example cell in a. c–h, Six different ways to infer the onset time and response strength of neural activity were used to compare with the original method described in Methods for six example cells in a. Processed calcium trace before starting inference (blue) and the inferred response (red) are shown on the left. Receptive fields/SNR curves derived from original or alternative method are shown on the right. i–l, Change in peak SNR (i) and peak time (j), receptive field similarity index (k), deviation of the RF/subfields center estimation (l) illustrating that the main conclusions regarding receptive field structure and fine visuotopic organization are not altered by the signal processing method employed (N = 143 cells from 3 animals). All error bars indicate s.e.m.

