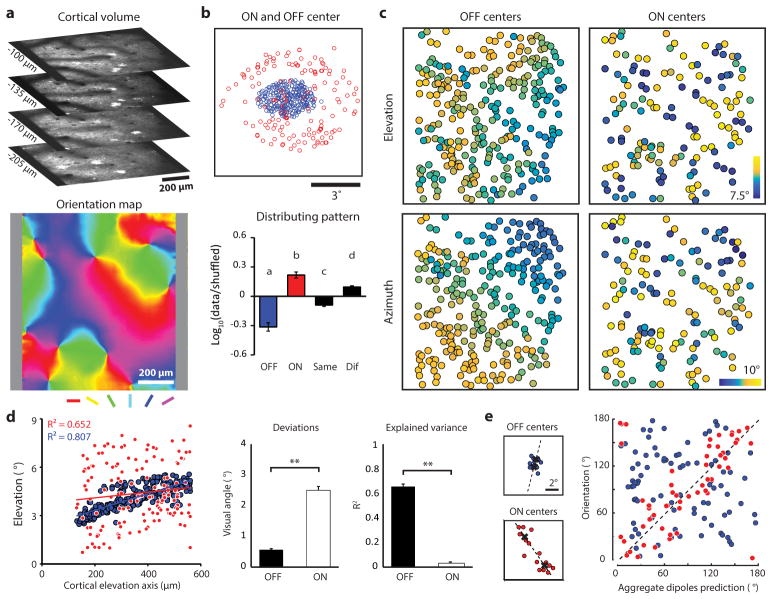
Extended Data Figure 4. ON and OFF receptive field organization of single sign cells.
a, The cortical volume and the orientation map of an example imaging area. b, The ON and OFF centers from single sign cells display an arrangement similar to the simple cell population. The bottom plot shows that the distribution pattern of ON and OFF receptive fields is consistent with the ON- and OFF- subfields of the simple cell population (N = 8 imaging areas from 7 animals, Kruskal-Wallis test; compare with Fig 1c and d, letters indicating groups with statistically significant difference, P < 0.01). c, The visuotopic organization of ON and OFF receptive field centers was similar to the simple cell ON- and OFF- subfields. d, The relation between cortical distance and visuotopic position demonstrating the difference in visuotopic precision for ON and OFF receptive fields (linear regression). Deviations of the experimental results from the linear fit and explained variance of the smooth visuotopy (N = 16 visuotopic maps, combining elevation and azimuth results from 8 imaging areas, **p < 0.0001, rank-sum test) are consistent with the results from simple cell ON- and OFF subfields. e, Only the displacement of the population ON receptive field center, but not OFF receptive field center, can predict the orientation tuning of the orientation column (circular correlation, N = 68 cortical columns, P = 9.51 × 10⁻³ for ON; N = 89 cortical columns, P = 0.586 for OFF). All error bars indicate s.e.m.

