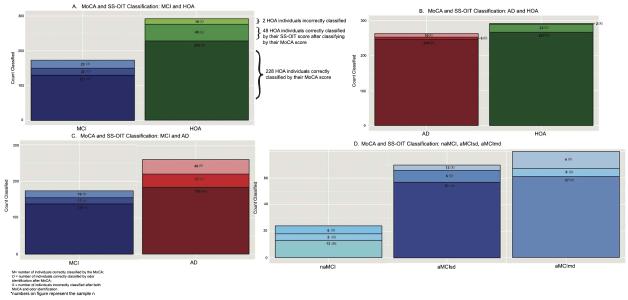
Fig. 3.
Classification accuracy of MoCA and SS-OIT scores by diagnosis. The bottom portion of each bar represents the number of individuals correctly classified by the optimal MoCA score (M). The middle portion of each bar indicates the number of individuals that were misidentified by MoCA score, but correctly identified by SS-OIT score (O). The top portion of each bar represents the number of individuals misidentified by both MoCA and SS-OIT score (X).

