Figure 3.
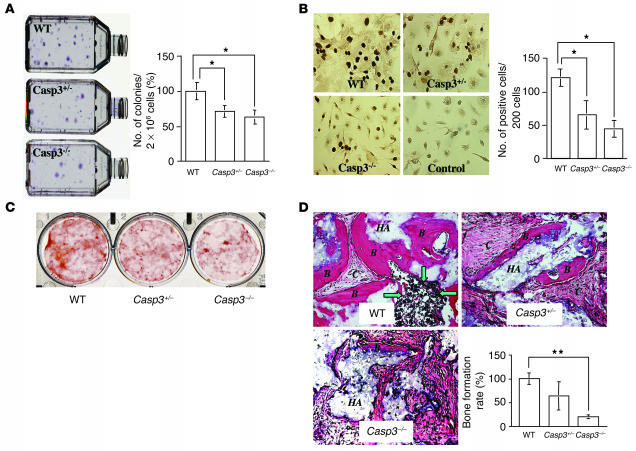
Proliferation and osteogenic differentiation of BMSSCs in caspase-3–deficient mice. (A) Appearance of CFU-F derived from WT, Casp3+/–, and Casp3–/– mice (left). There was a significant difference in the number of colonies between caspase-3–deficient mice (Casp3–/– and Casp3+/–) and WT mice (right). Error bars represent the mean ± SD (n = 10; *P < 0.001). (B) BrdU incorporation of BMSSCs. The proliferation rate of cultured BMSSCs was assessed by BrdU incorporation assay for 24 hours. Representative pictures are shown at left. Original magnification, ×400. The number of BrdU-positive cells is indicated as a percentage of the total number of counted BMSSCs and averaged from 5 replicated cultures. Error bars represent mean ± SD (n = 5; *P < 0.001). (C) Alizarin red staining of BMSSCs cultured under the osteogenic inductive condition. Casp3–/– and Casp3+/– BMSSCs showed a lower calcium accumulation than WT BMSSCs. (D) Bone formation by BMSSCs in vivo. BMSSCs were transplanted into immunocompromised mice with HA/TCP (HA). Bone formation assessed by H&E staining was decreased in Casp3–/– and Casp3+/– transplants compared with WT transplants. B, bone; C, connective tissue; green arrows, hematopoeitic marrow elements. Original magnification, ×200. The BFR was calculated as the percentage of newly formed bone area per total area of transplant at the representative cross-sections. The graph represents mean ± SD of the percentage of WT (WT, n = 3; Casp3+/–, n = 5; Casp3–/–, n = 4; **P < 0.0001).

