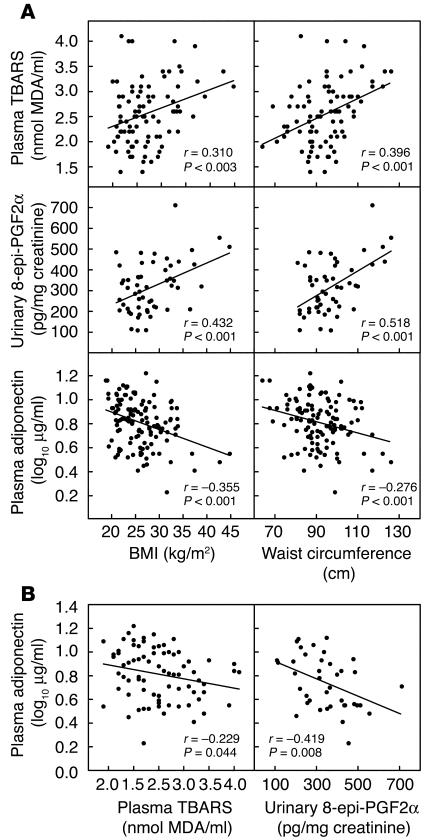
Figure 1.
Levels of lipid peroxidation and plasma adiponectin in nondiabetic subjects. (A) Correlation of plasma TBARS, urinary 8-epi-PGF2α, and plasma adiponectin with BMI and waist circumference. (B) Correlation of plasma adiponectin with plasma TBARS and urinary 8-epi-PGF2α. Pearson’s correlation coefficient (r) is shown for each relationship. MDA, malondialdehyde.

