Figure 7.
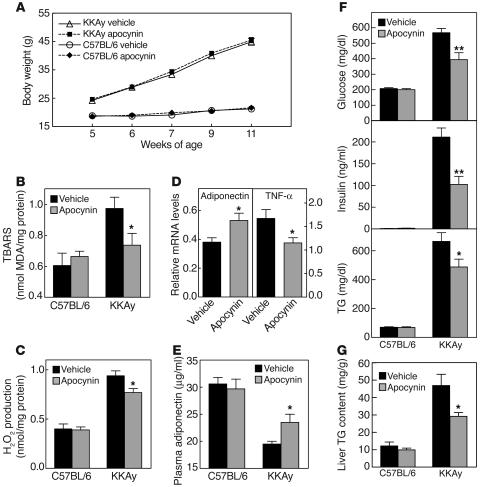
In vivo effects of an NADPH oxidase inhibitor, apocynin, on adipocytokine expression, and glucose and lipid metabolism in KKAy mice. (A) Body weight of C57BL/6 and KKAy mice, treated with or without apocynin for 6 weeks. (B) Lipid peroxidation in WAT, and (C) release of H2O2 from WAT of C57BL/6 and KKAy mice, treated with or without apocynin for 6 weeks. (D) The mRNA expression levels of adiponectin and TNF-α in WAT of KKAy mice. Values are normalized to the level of cyclophilin mRNA. (E) Plasma adiponectin concentrations in C57BL/6 and KKAy mice. (F) Plasma glucose, insulin, and TG concentrations in C57BL/6 and KKAy mice. (G) Liver TG content in C57BL/6 and KKAy mice. Values are expressed as mean ± SEM (n = 8). *P < 0.05 and **P < 0.01 compared with vehicle-treated group.

