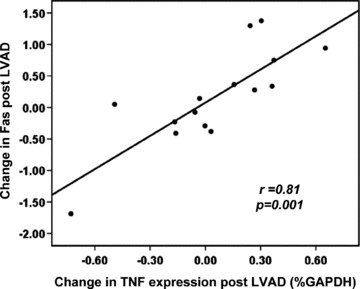
Figure 3.

Scatter plot of the relationship of the change in Fas expression after LVAD implantation. Fas expression in% GAPDH on the y‐axis, with the change in TNF expression on the x‐axis. The change in Fas significantly correlates with the change in TNF (r= 0.81, p < 0.001).
