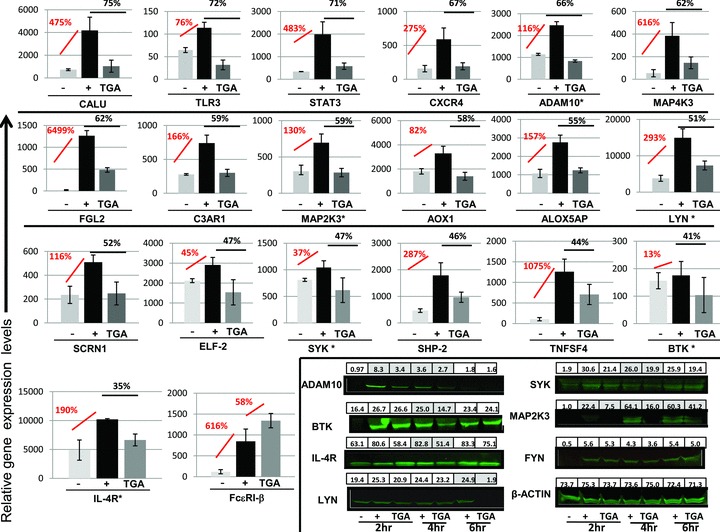
Figure 3.

Microarray analysis of FcɛRI activated genes affected by TGA. MC were pretreated with or without 10 μg/mL TGA overnight at 37°C/6% CO2. The next day cells were washed and challenged with (+) or without (−) anti‐FcɛRI (1 μg/mL) for 2 hours. Cell pellets were used for RNA isolation and gene microarray as described above or used for Western blotting. Each condition was performed in triplicate. What is shown is the mean of the relative intensities of each gene (±SD of six observed values). The red bar/numbers is the percent increase in resting cells compared to FcɛRI‐activated cells and the black bar/numbers is the percent inhibition comparing FD pretreated and activated cells compared to non‐FD‐treated FcɛRI‐treated cells. For Western blotting, approximately 200,000 cell equivalents/lane were loaded onto a 10% tris‐glycine gel and Western blotted with the indicated Abs as described previously. 20
