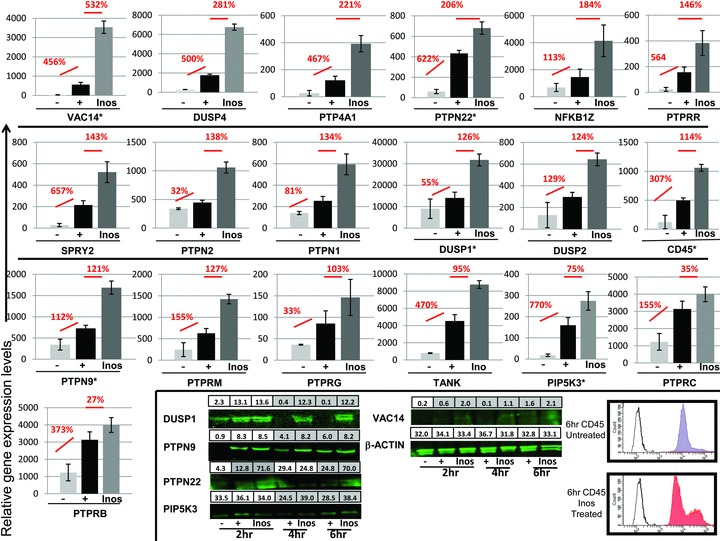
Figure 4.

Microarray analysis of FcɛRI activated genes affected by Inos. MC were treated and analyzed as in Figure 3. Given the large size of CD45 (220 kDa) and difficulty in gel‐to‐membrane transfer FACS analysis was used to monitor upregulation: mouse IgG Isotype control (black line), untreated FITC labeled CD45 (gray filled), and Inos treated Fluorescein isothiocyanate (FITC) labeled CD45 (red filled).
