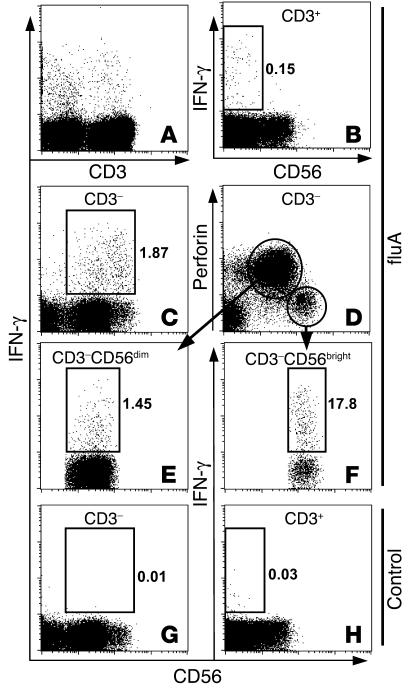
Figure 1.
IFN-γ production by T cells and CD56dim and CD56bright NK cell subsets in response to fluA. PBMCs from an adult donor were incubated with fluA (A–F) or SPG (negative control, G and H) for 17 hours, with brefeldin A added during the last 5 hours. The cells were stained for CD56, fixed and permeabilized, and then stained for CD3, IFN-γ, and perforin. See Methods for details. Displayed in the dot plots A–H are cells gated on different lymphocyte populations: (A) IFN-γ production of CD3– and CD3+ lymphocytes (gated by forward scattering and side scattering) in response to fluA; (B) IFN-γ production of CD3+ lymphocytes in response to fluA; (C) IFN-γ production of CD3– lymphocytes in response to fluA; (D) expression of CD56 and perforin by CD3– lymphocytes; (E and F) IFN-γ production of CD56dim perforin+ NK and CD56bright perforin– NK subsets, respectively, in response to fluA; (G and H) negative controls showing baseline levels of IFN-γ production by CD3– and CD3+ lymphocytes in the absence of fluA. Numbers in the dot plots refer to percentage of IFN-γ+ cells in the gated population.

