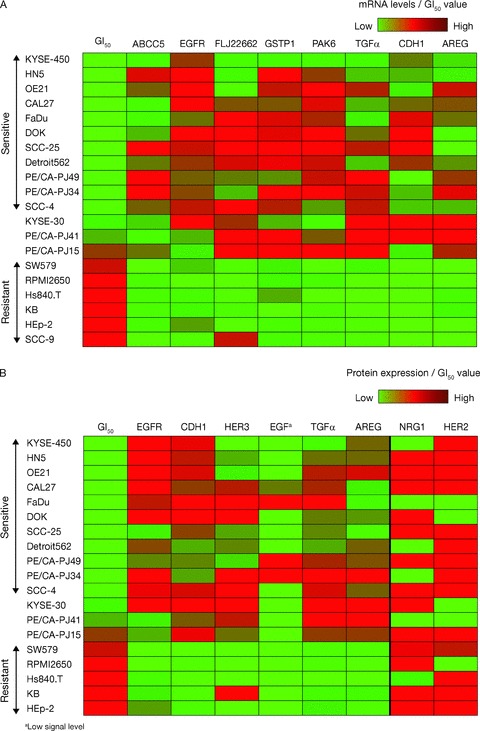
Figure 2.

Baseline mRNA and protein expression levels and association with sensitivity to gefitinib. (A) Association between mRNA levels of ABBC5, EGFR, FLJ22662, GSTP1, PAK6, TGF‐α, CDH1, and AREG and gefitinib sensitivity. (B) Left panel: significant association between protein levels of EGFR, CDH1, HER3, EGF, TGF‐α, and AREG and gefitinib sensitivity; right panel: no statistically signifi cant association at the 5% level between protein levels of NRG1 and HER2 and gefitinib sensitivity.
