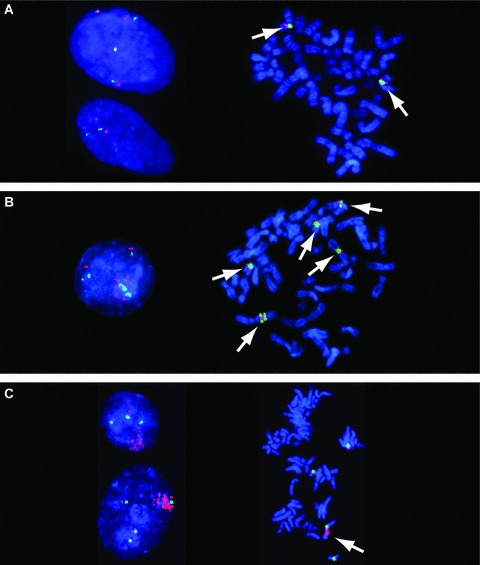
Figure 4.

Profiling for EGFR genomic gain. Examples of (A) no EGFR genomic gain, (B) unbalanced EGFR gain based on cell ploidy, and (C) EGFR gene amplification. (A) FISH images showing no EGFR genomic gain. Cell line Hs840.T has a low EGFR gene copy number. Interphase nuclei (left image) show two and four copies of each DNA target. Metaphase spread (right image) shows two chromosomes harboring EGFR (red signals) and CEP7 (green signals), as indicated by arrows. (B) FISH images showing unbalanced EGFR gain based on cell ploidy. Cell line KYSE‐450 has chromosomal aneuploidy, leading to gain of EGFR gene copy numbers. The interphase nucleus (left image) shows numerous copies of EGFR (red signals). Metaphase analysis (right image) identified this line as hyperdiploid, with, on average, five chromosomes carrying EGFR sequences (as indicated by arrows). (C) FISH images showing EGFR gene amplification. Cell line HN5: interphase nuclei (left image) show large clusters of EGFR (red signals). The cluster was mapped to a chromosome 7 derivative (as indicated by arrow) by metaphase analysis (right image).
