
Figure 5.
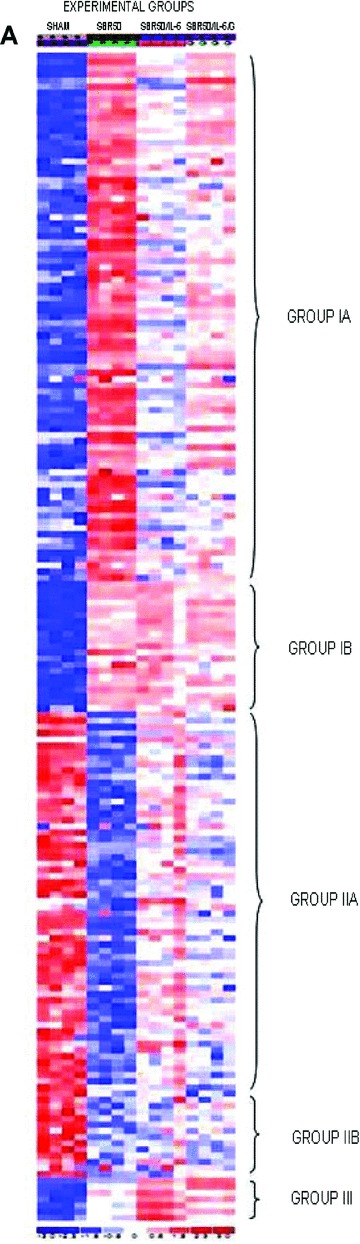
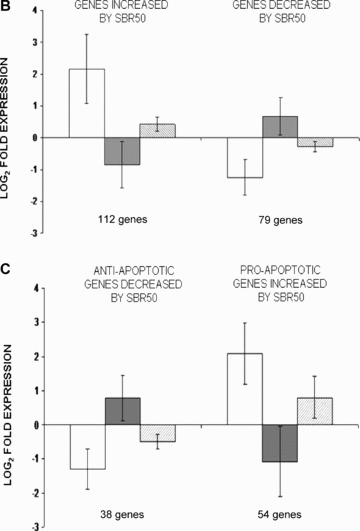
Effect of T/HS without or with IL‐6 treatment on lung apoptosis‐related gene expression and impact of Stat3 inhibition on the IL‐6 effect. (A) A heat map of apoptosis pathway genes is shown containing those genes whose expression is altered 2‐fold or more within the four groups. Columns represent samples from the four groups examined as indicated (S = Sham; P = placebo‐treated SBR50; I = IL‐6‐treated SBR50/IL‐6; and G = animals pretreated with G‐quartet ODN prior to T/HS and IL‐6 treatment, SBR50/IL‐6/G). Rows represent genes as listed in Table S1 (Supporting Information). Red indicates a level of expression above the mean expression of a gene within the experimental group. White indicates a level of expression at the mean within the experimental group, whereas blue indicates a level of expression below the mean within the experimental groups. Logarithm in base 2 of fold expression levels (Log2‐fold) changes in expression levels of subsets of apoptosis‐related genes are shown in (B) and (C) comparing SBR50 versus sham (open bars), SBR50/IL‐6 versus SBR50 (gray bars), and SBR50/IL‐6/G versus SBR50/IL‐6/N (stippled bars). (B) The 191apoptosis‐related genes whose expression levels were changed by 2‐fold or more in SBR50 versus sham were separated into those genes whose transcript levels were increased in SBR50 versus sham (112 genes; left side of the panel) and those whose transcript levels were decreased in SBR50 versus sham (79 genes; right side of the panel). Bars shown represent mean ± SD of the log2‐fold change in gene expression levels for each comparison. (C) The overall effect of T/HS on transcript levels of anti‐ and proapoptotic genes is shown. In the left side of the panel, the mean ± SD of the log2‐fold change in gene expression levels of 38 antiapoptotic genes whose expression was decreased in the SBR50 versus sham comparison is shown (open bar). The expression of all of these genes was increased in the SBR50/IL‐6 versus SBR50 comparison (gray bar). In the right side of the panel, the mean ± SD of the log2‐fold change in gene expression levels of 54 proapoptotic genes whose expression was increased in the SBR50 versus sham comparison is shown (open bar). The expression of 51 of 54 of these genes was decreased in the SBR50/IL‐6 versus SBR50 comparison (gray bar).