
Figure 1.
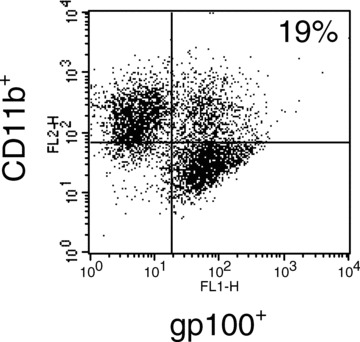
FACS characterization of electrofusion product. Fusion efficiency was evaluated by flow cytometry measuring the percentage of double positive cells expressing both gp 100 (tumor cell marker) and CD11 b (DC marker). A representative FACS plot is shown. Fusion efficiencies ranged from 5% to 20%.