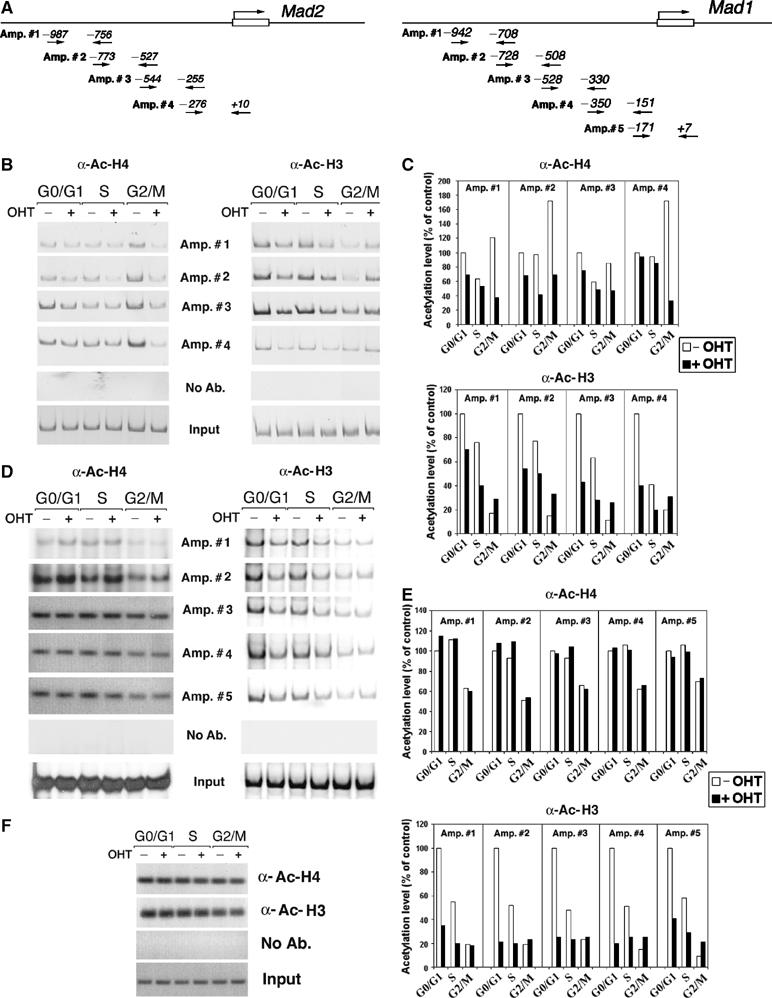
Figure 3.

Effect of Trrap deletion on histone acetylation at the Mad gene promoters. (A) Schematic representation of the mouse Mad2 and Mad1 promoter. The arrows indicate the primers used in PCR amplification reactions and the numbers denote the position in relation to the start site. (B) ChIP analysis of histone acetylation at the Mad2 promoter. CER9 cells were synchronized as in Figure 2B and DNAs immunoprecipitated either by anti-acetyl-histone H4 or anti-acetyl-histone H3 were analyzed by PCR using primers recognizing the Mad2 promoter. (C) Quantification of acetylation levels at the Mad2 promoter in (B) by densitometric analysis and normalization versus input. (D) ChIP analysis of histone acetylation at the Mad1 promoter. Samples prepared as in (B) were analyzed by PCR using primers recognizing the Mad1 promoter. (E) Quantification of acetylation levels at the Mad1 promoter was carried out as in (D). (F) ChIP analysis of histone acetylation at the GAPDH promoter. Samples prepared as in (B) were analyzed by using primers recognizing the GAPDH promoter. As a control, mock immunoprecipitations without addition of antibodies (No Ab.) were included. Input corresponds to PCR reactions containing 1/150 of the total amount of chromatin used in immunoprecipitation reactions.
