Figure 2.

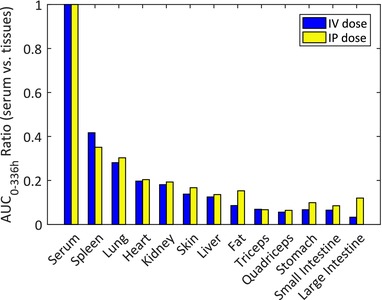
Ratio of tissue area under the serum concentration‐time curve (AUC)0–336h to serum AUC0–336h after i.v. or i.p. administration of 125I‐MYO‐029 at 1 mg/kg to C57/SCID mice.

Ratio of tissue area under the serum concentration‐time curve (AUC)0–336h to serum AUC0–336h after i.v. or i.p. administration of 125I‐MYO‐029 at 1 mg/kg to C57/SCID mice.