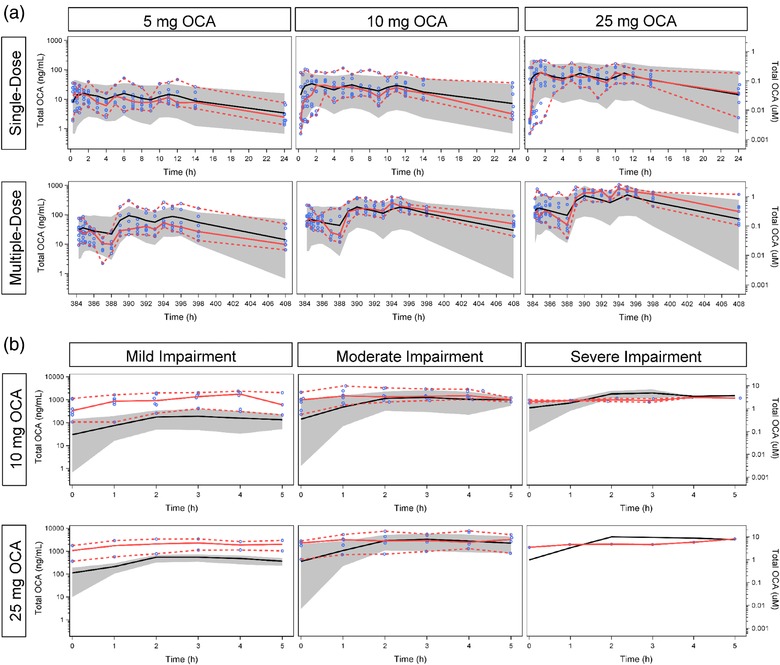
Figure 4.

External Validation of the Physiologic Pharmacokinetic Model. (a) Healthy volunteers with normal hepatic function. (b) Subjects with impaired hepatic function. Blue circles represent observed data points. Solid red line represents median of observed data. Dashed red lines represent the 5th and 95th percentiles of observed data. Solid black line represents predicted median. Gray band represents the 90% prediction interval.
