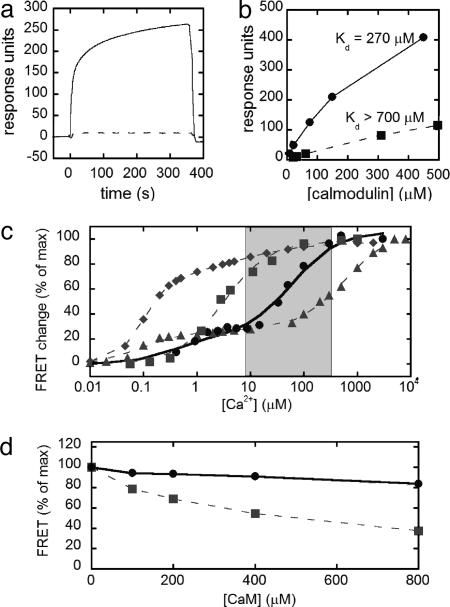
Fig. 1.
In vitro characterization of the mutant CaM and peptide and the resulting redesigned cameleon. (a) Biacore sensorgram of WT CaM binding to skMLCK (solid line) and four-charge reversal skMLCK (dashed line). CaM was injected over the surface in the presence of saturating Ca2+ starting at time t = 0 for 360 s. (b) Binding of WT (squares, dashed line) and mutant (circles, solid line) CaM to mutant skMLCK with four-charge reversals. The binding of CaM reached a steady state during the association phase, and therefore a Scatchard analysis was used to determine the dissociation constants (Fig. 8). (c) In vitro calcium titration curves of YC2.1 (diamonds, dashed line), YC3.3 (squares, dashed line), YC4.3 (triangles, dashed line), and D1 (circles, solid line), along with corresponding fits of the data. The gray box represents the typical range of [Ca2+] in the ER, from resting to the depleted state. (d) Percent of the maximum FRET response of YC3.3 (squares) and D1 (circles) with increasing concentrations of WT CaM.

