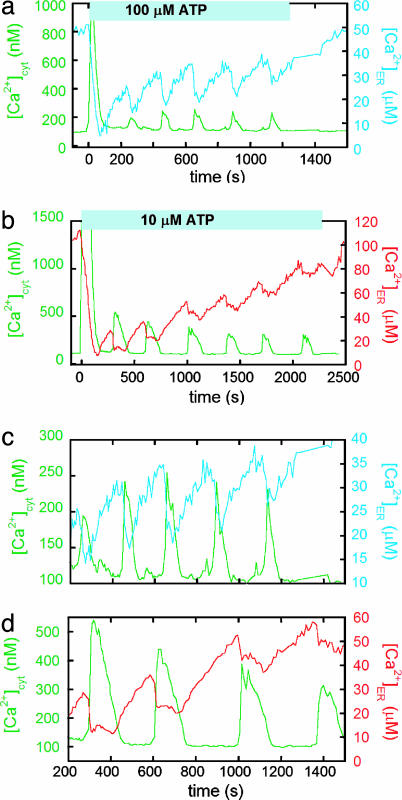
Fig. 4.
Comparison between ATP-induced Ca2+ oscillations in the cytosol and the ER for Bcl-2 and neo MCF-7 cells. The differences between Bcl-2 (a and c) and neo (b and d) cells are highlighted in c and d, which are on the same timescale and focus on the oscillations induced by ATP. The [Ca2+]cyt signal is in green, and the [Ca2+]ER signal is in blue for Bcl-2 and red for neo cells. The fura-2 excitation ratio (350/380 nm) and cameleon emission ratio (citrine/CFP) were converted to [Ca2+], as outlined in Materials and Methods.

