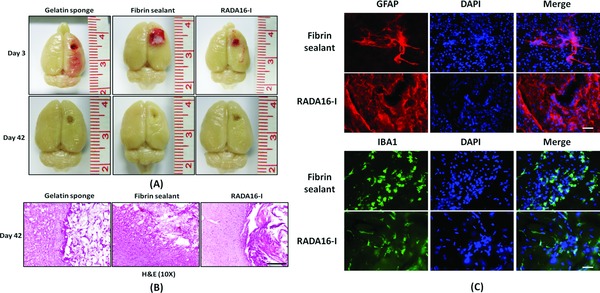
Figure 2.

(A) Macroscopic appearances of representative brain specimens on day 3 and 42; (B) H&E examination of the boundary zone between the brain and the lesion cavities (*) on day 42; (C) Immunohistochemical studies of the fibrin sealant and RADA16‐I in situ, showing infiltration by microglia and astrocytes on day 42 (40×). Scale bar: B = 50 mm, C = 20 μm.
