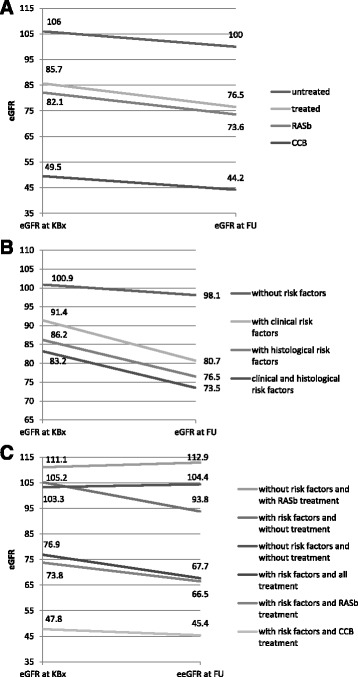
Fig. 1.

eGFR decline according to treatment regimens and IgAN progression risk factors. a. eGFR decline in the IgAN patient’ subgroup according to treatment regimens: untreated (N = 27), all drug-treated (N = 38) and RASb- (N = 31) and CCB-treated (N = 6). b. eGFR decline in the IgAN patient’ subgroups according to clinical and pathomorphological IgAN progression risk factors: without risk factors (N = 17), with clinical risk factors (N = 45), with histological risk factors (N = 38), with clinical and histological risk factors (N = 27). c. eGFR in the IgAN patient’ subgroups according to risk factors and the presence of treatment. eGFR, estimated Glomerular Filtration Rate; KBx, kidney biopsy, FU, follow-up
