Fig. 1.

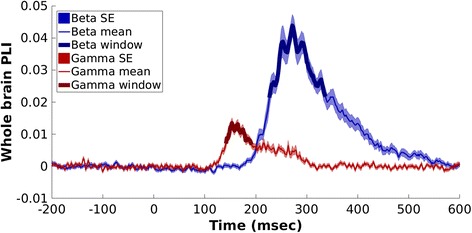
Mean “whole brain” connectivity response in beta and gamma bands across groups and conditions. The time windows selected for further analyses are represented with thicker lines

Mean “whole brain” connectivity response in beta and gamma bands across groups and conditions. The time windows selected for further analyses are represented with thicker lines