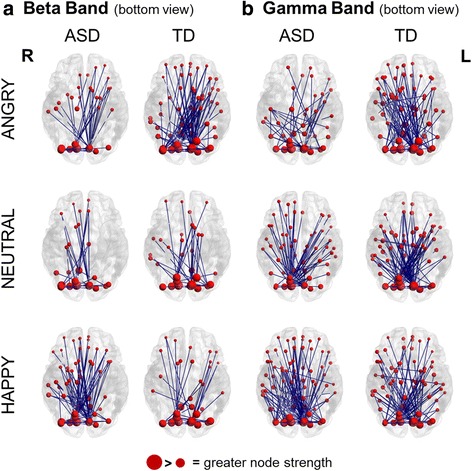
Fig. 2.

Task-dependent increases in connectivity for each group and condition. a Task-dependent increases in beta band; b task-dependent increases in gamma band. Blue lines represent significant connections between seeds. The brains are viewed from the bottom. R = right, L = left, ASD = autism group, TD = typically developed group
