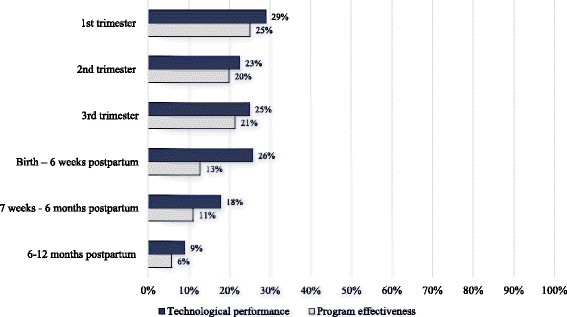
Fig. 5.

Program effectiveness and technological performance for each stage of the continuum of care from October 2011 to September 30, 2014 in 5 districts of Ghana. The dark blue bars reflect the proportion of messages received out of those expected, while the light grey is the proportion of messages that each woman listened out of the total they were expected to receive including those not received
