
Figure 3.
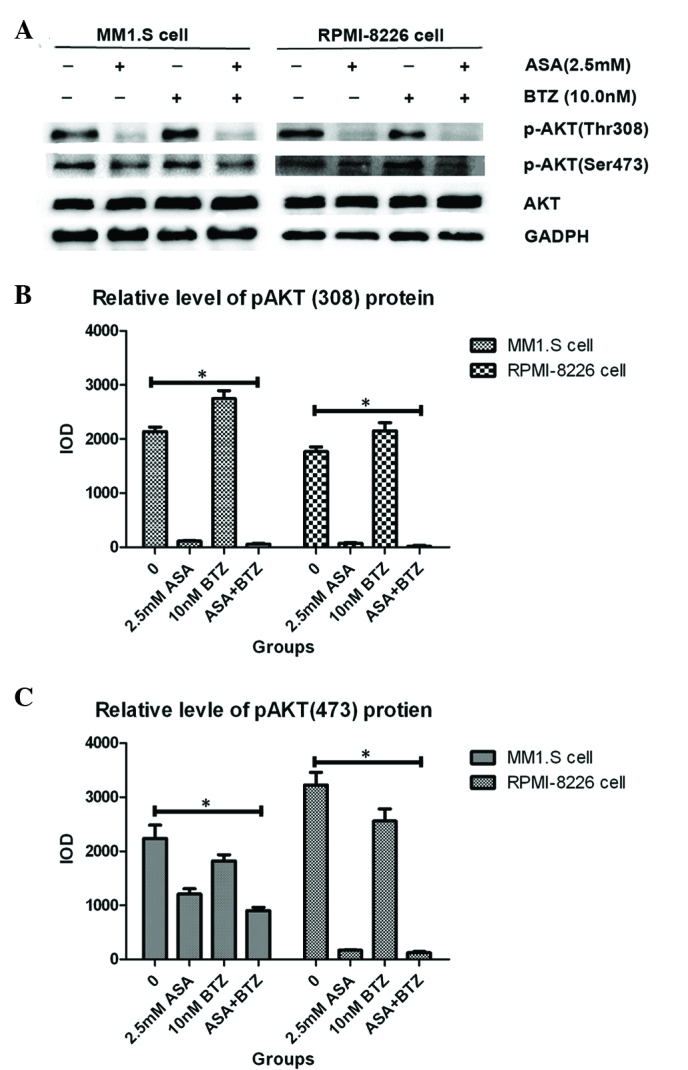
Effect of ASA and/or BTZ treatment on expression of p-AKT in myeloma cells. (A) MM1.S and RPMI-8226 cells were treated with ASA, BTZ and ASA+BTZ for 48 h, respectively, following which the whole cell lysates were prepared using Phosphosafe™ extraction reagent. The levels of p-AKT (Thr 308 and Ser 473) and AKT were analyzed using western blot analysis with corresponding antibodies. Each blot is representative of three independent experiments. (B) Integrated optical density data of p-AKT(308) are presented as the mean ± standard deviation. (C) Integrated optical density data of p-AKT(473) are presented as the mean ± standard deviation. *P<0.05. p-AKT, phosphorylated AKT; ASA, aspirin; BTZ, bortezomib; Bcl-2, B cell lyphoma-2.