
Figure 5.
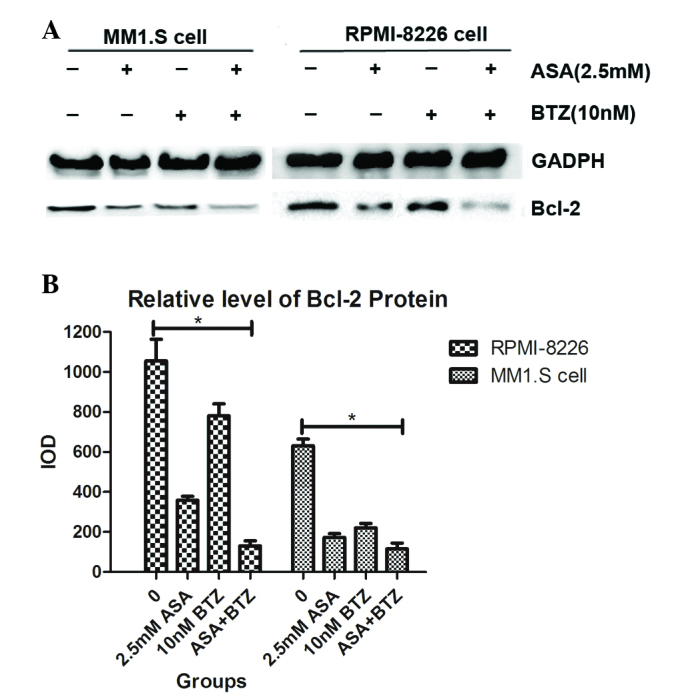
Effect of ASA and/or BTZ on the expression of Bcl-2 in myeloma cells. (A) The MM1.S and RPMI-8226 cells were exposed to ASA, BTZ and ASA+BTZ for 48 h, respectively. The protein level of Bcl-2 was analyzed using western blot analysis. Each blot is representative of three independent experiments. (B) Integrated optical density data are presented as the mean ± standard deviation. *P<0.05. ASA, aspirin; BTZ, bortezomib; Bcl-2, B cell lymphoma-2.