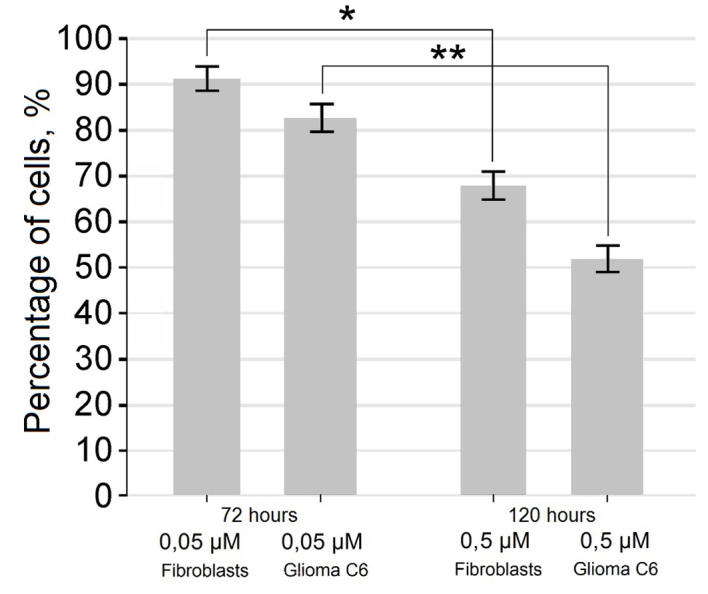
Figure 4.

Growth dynamics of the total number of C6 glioma cells and fibroblasts (observation period, 72 and 120 h) following exposure to fascaplysin at 0.005 and 0.5 µM. **,*P<0.05 compared different concentrations of fascaplysin between glioma C6 cells and fibroblasts at different time intervals.
