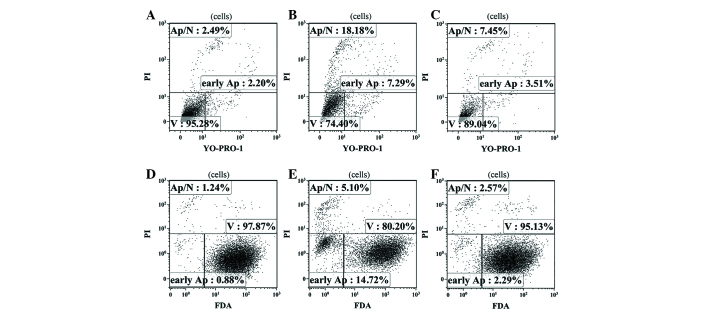
Figure 6.
Histograms of the apoptosis of C6 glioma cells following 6 h of exposure to fascaplysin. (A) C6 glioma cells were incubated in culture medium (negative control). (B) C6 glioma cells following 6 h of exposure to 0.5 µM fascaplysin. (C) C6 glioma cells following 6 h exposure to fascaplysin at concentration 0.05 µM. The abscissa shows the fluorescence intensity of YO-PRO-1 iodide (λ=533±30 nm), and the ordinate shows the fluorescence intensity of propidium PI (λ>670 nm). The ‘V’ population of living cells was not stained by any of the dyes; ‘early Ap’ cells were stained only by YO-PRO-1 iodide, which corresponds to the early stages of apoptosis; ‘Ap/N’ dead cells were positively stained with both dyes, which corresponds to the later stages of apoptosis and necrosis. The result is expressed as a percentage of the total cells analyzed. (D) C6 glioma cells incubated in culture medium (negative control). (E) C6 glioma cells following 6 h of exposure to 0.5 µM fascaplysin. (F) C6 glioma cells following 6 h of exposure to 0.05 µM fascaplysin. The abscissa shows the fluorescence intensity of FDA (λ=533±30 nm), and the ordinate shows the fluorescence intensity of PI (λ>670 nm).‘V’ represents the population of living cells, which were intensely stained by FDA; ‘Ap’ cells were weakly by stained FDA and negative for PI, which corresponds to the early stages of apoptosis; ‘Ap/N’ dead cells were weakly stained by the FDA and intensely incorporated PI, which corresponds to the later stages of apoptosis and necrosis. The result is expressed as a percentage of the total cells analyzed. FDA, fluorescein diacetate; PI, propidium iodide.

