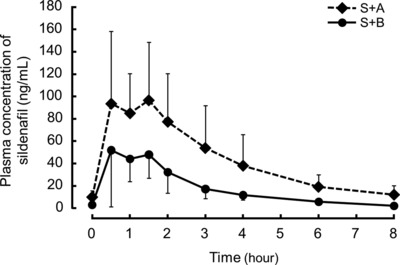
Figure 2.

Sildenafil concentration–time curves of the two coadministration therapies. The solid line shows the sildenafil concentration when coadministered with bosentan (S+B), and the dotted line shows the sildenafil concentration when coadministered with ambrisentan (S+A). Values are expressed as mean ± SD.
