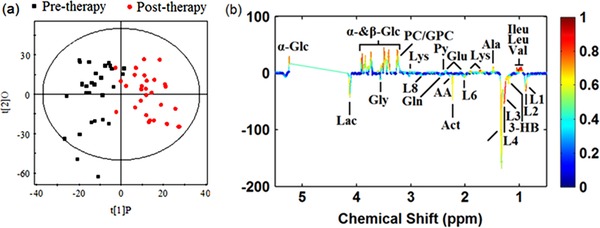
Figure 3.

(a) OPLS‐DA score plots obtained from pretherapy neonatal jaundice patients (black squares) and posttherapy neonatal jaundice patients (red dots). (b) The corresponding coefficient loading plots for the discrimination of the OPLS‐DA model shown in (a).
