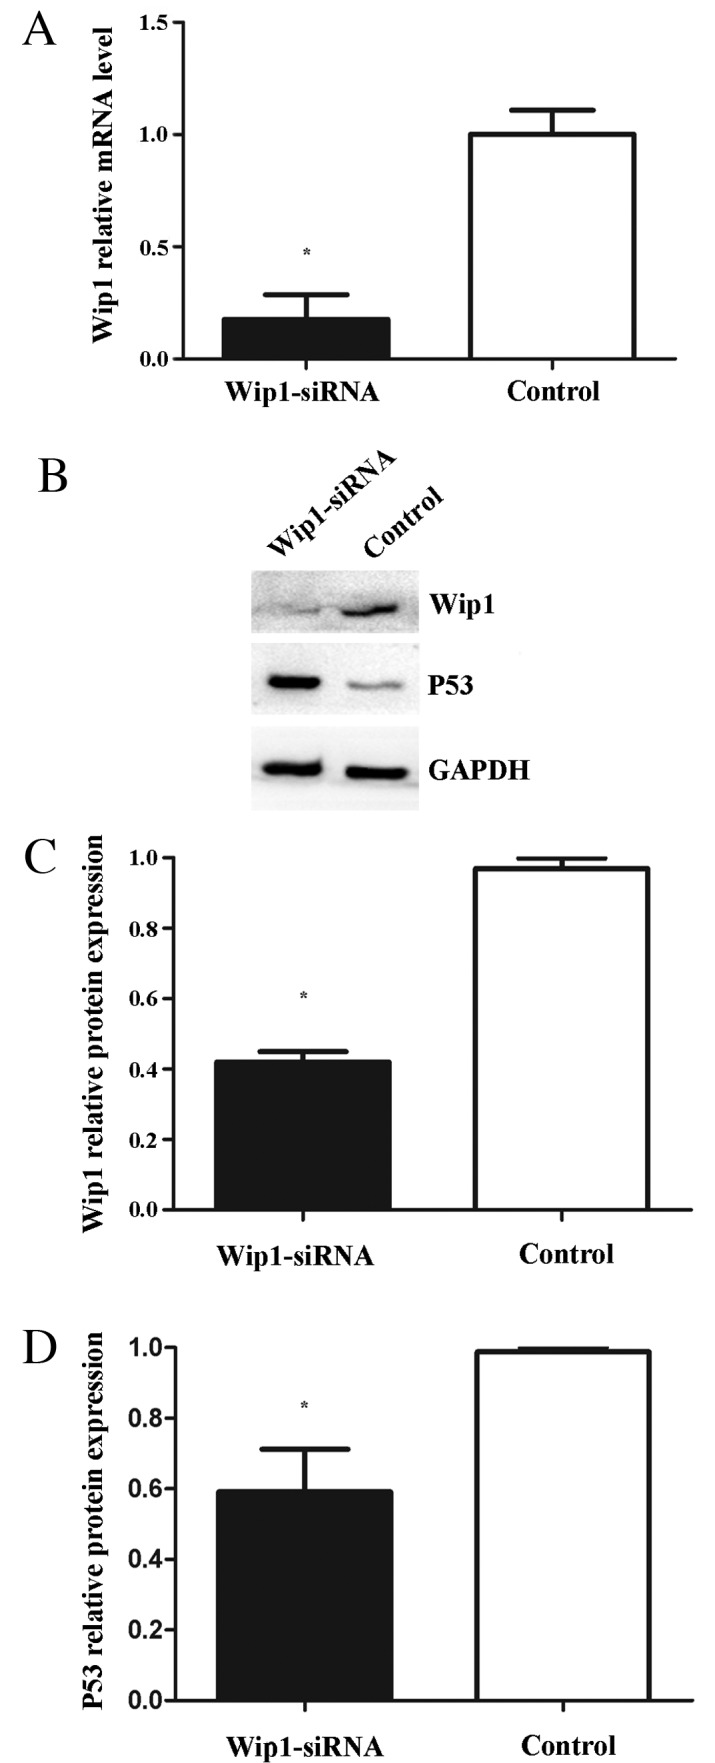
Figure 3.

(A) Reverse transcription-quantitative polymerase chain reaction analysis of Wip1 mRNA expression in T24 cells. (B and C) Western blot analysis of Wip1 protein expression levels in T24 cells. (B and D) Western blot analysis of p53 protein expression levels in T24 cells. Wip1 mRNA expression was downregulated in Wip1-siRNA-transfected cells (A, *P<0.05 vs. control). Wip1 protein expression was downregulated in Wip1-siRNA-transfected cells (B and C; *P<0.05 vs. control). P53 protein expression was upregulated in the Wip1-siRNA-transfected cells (B and D; *P<0.05 vs. control). Wip1, wild-type p53-induced phosphatase; siRNA, small interfering RNA.
