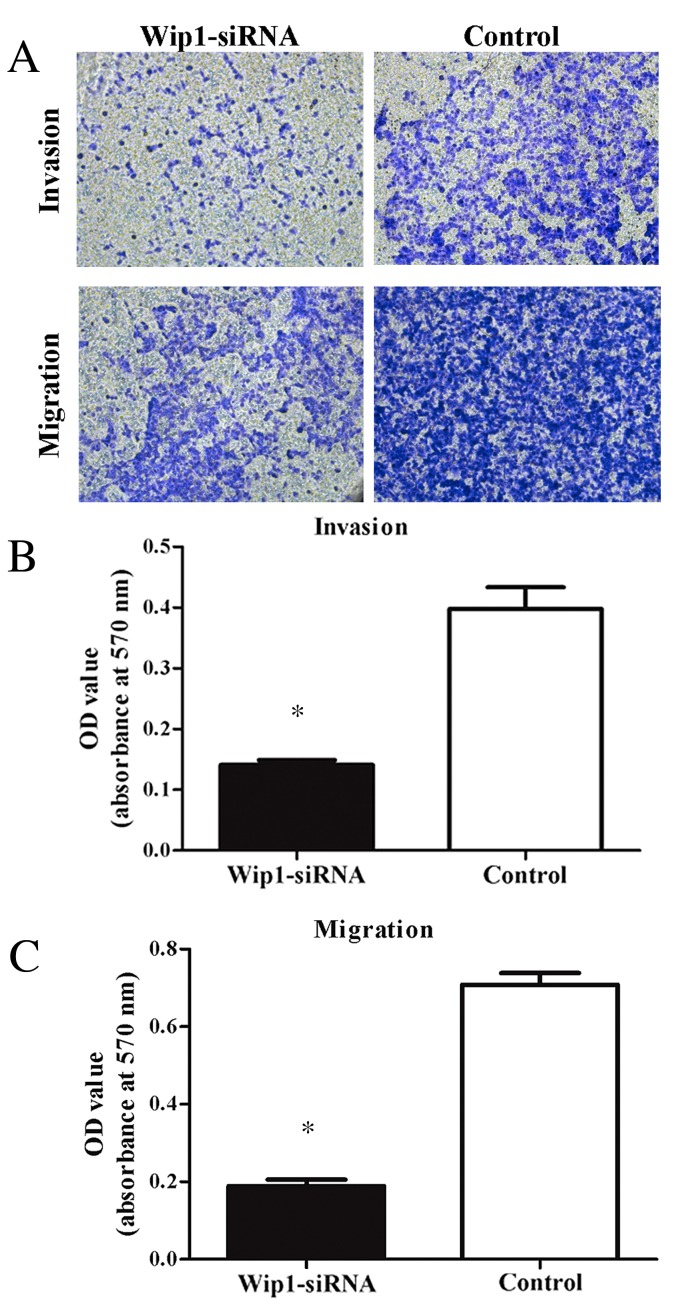
Figure 5.
Transwell assay analysis of cell invasion and migration. Downregulation of Wip1 inhibited T24 cell invasion and migration, compared with the control group (*P<0.05 vs. control). Magnification, ×200. Wip1, wild-type p53-induced phosphatase; siRNA, small interfering RNA; OD, optical density.

