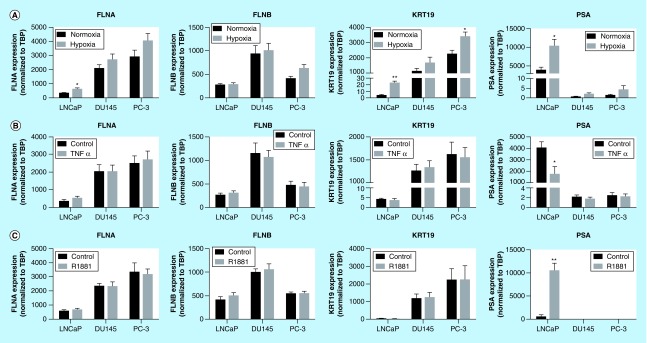
Figure 2. . Regulation of biomarkers by prostate cancer-relevant stimuli in vitro.
Cells were exposed to hypoxia (1% oxygen; A), TNFα (10 ng/ml; B) or R1881 (1 nM; C) for 24 h. Expression was assessed by quantitative RT-PCR and normalized to TBP. Data represent means ± SEM, N = 3. * p < 0.05 and ** p < 0.01 compared with normoxia or control. FLNA: Filamin-A; FLNB: Filamin-B; KRT19: Keratin-19; RT-PCR: Real-time PCR; SEM: Standard error of the mean; TBP: TATA-binding protein.

