
Figure 1. Annotation of PPFP peaks relative to genic and intergenic regions.
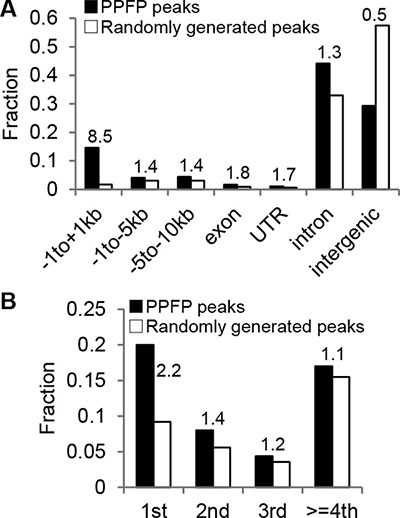
(A) Peaks with more than one annotation were assigned to one region only with prioritization going from left to right. (B) The intron group of A is divided into individual introns. The numbers above the bars indicate the ratios of PPFP to randomly generated peaks.