
Figure 2. PPFP peaks contain PAX8 and/or PPARG motifs.
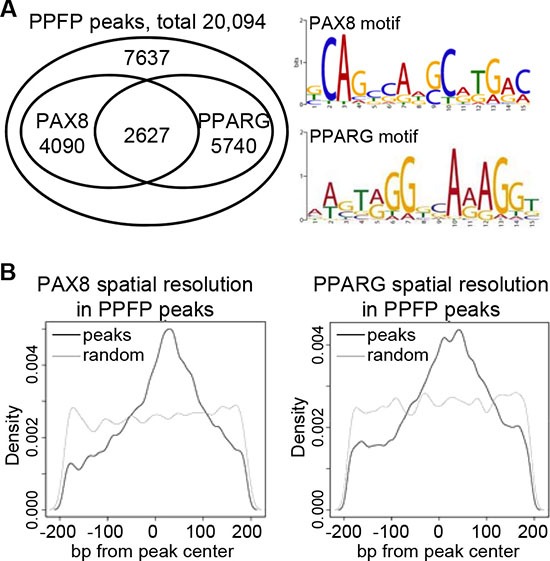
(A) Venn diagram showing the overlap of PAX8 and PPARG motifs within PPFP peaks, and the logos for PAX8 and PPARG motifs. (B) Spatial resolution analysis of PAX8 and PPARG motifs within PPFP peaks (black lines). The grey lines show the distribution of each motif in randomly generated 400 bp regions across the genome, as negative controls.