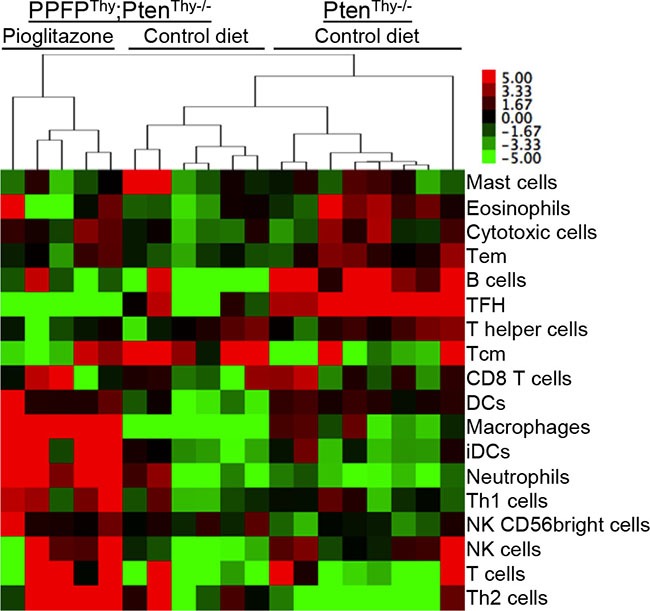
Figure 4. Heat map of overall gene expression scores for types of immune cells in thyroid glands of PPFPThy;PtenThy−/− mice fed pioglitazone or control diet, or PtenThy−/− mice fed control diet.

A heat map of expression of the individual genes used to determine the overall scores is found in Figure S3. Gene expression was measured by RNA-seq. The samples and cell types were clustered by hierarchical clustering using average linkage and the correlation distance measure. Abbreviations: Tem, T effector memory; TFH, T follicular helper; Tcm, T central memory; DCs, dendritic cells; iDCs, immature DCs; Th1, T helper 1; NK, natural killer; Th2, T helper 2.
