
Figure 1. Effects of high- and low-dose bortezomib on the viability and degranulation of induced NK and γδ T cells.
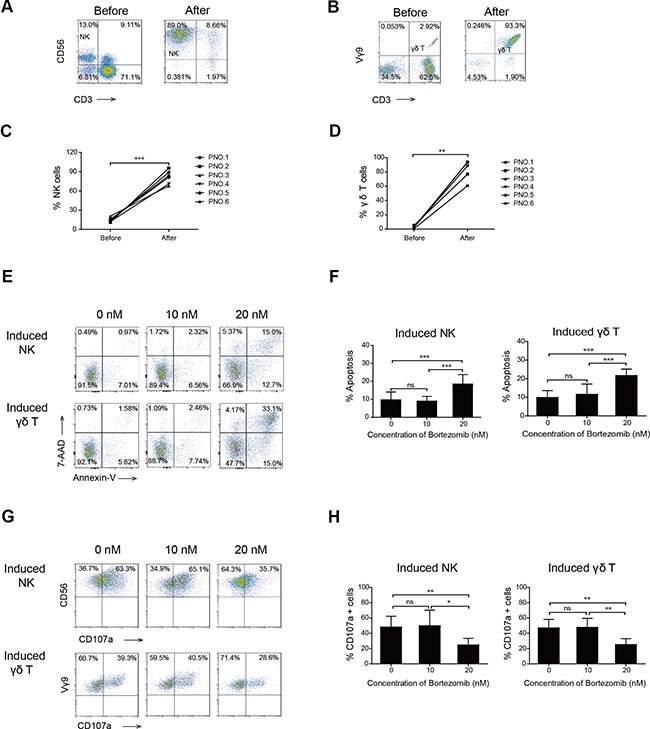
A representative FACS plot showing the percentage of NK (A) and γδ T cells (B) cells before and after 14 days of induction in patient number five. Graph showing the percentage of NK (C) and γδ T cells (D) before and after 14 days of induction in six patients with MM. (E) Viability of induced NK and γδ T cells after exposure to bortezomib. One representative experiment is shown. (F) Graph showing the apoptosis percentages of induced NK and γδ T cells exposed to increasing doses of bortezomib that were annexin V positive. (G) Representative FACS results show CD107a positive cells of induced NK and γδ T cells. (H) Comparison of the percentage of CD107a positive cells of induced NK and γδ T cells treated with increasing doses of bortezomib. (*p < 0.05; **p < 0.01; ***p < 0.001; ns: not significant).