
Figure 2. Bortezomib increased MICA, MICB, Nectin-2, and PVR expression on MM cells.
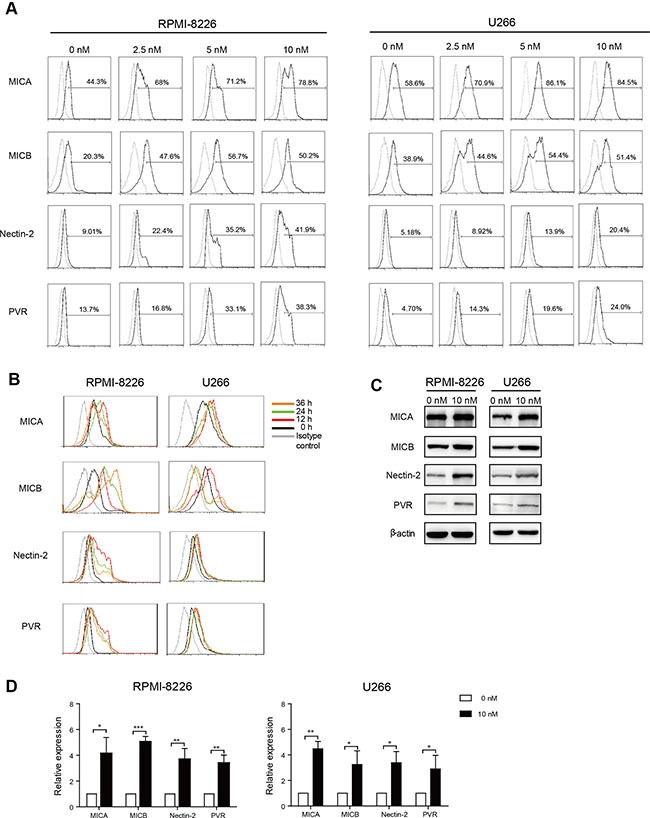
Annexin V and 7-AAD double negative cells were gated and analyzed for surface marker expression. (A) Dose response: RPMI-8226 and U266 cells were exposed to increasing doses of bortezomib for 12 h. (B) Time course: RPMI-8226 and U266 cells were incubated with low-dose (10 nM) bortezomib for increasing durations of time. (C) Representative western blot analysis of MICA, MICB, Nectin-2, and PVR expression in low-dose bortezomib-treated MM cells. β-actin was used as a loading control of cell lysates. (D) qRT-PCR analysis of MICA, MICB, Nectin-2, and PVR expression in RPMI-8226 and U266 cells exposed to low-dose bortezomib for 12 h. Data are expressed as relative expression of MICA, MICB, Nectin-2, and PVR mRNA in low-dose bortezomib-treated MM cells over that of normal saline-treated control cells (*p < 0.05; **p < 0.01; ***p < 0.001).