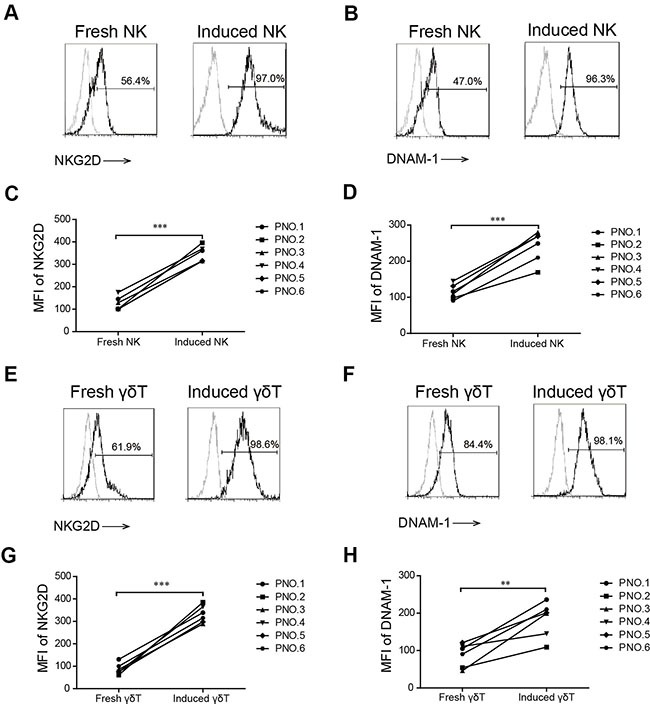
Figure 4. NKG2D and DNAM-1 expression in induced and fresh NK and γδ T cells.

The percentage of NKG2D (A) and DNAM-1 (B) on fresh and induced NK cells in patient number five. The mean fluorescence index (MFI) of NKG2D (C) and DNAM-1 (D) on induced and fresh NK cells in six patients with MM. The percentage of NKG2D (E) and DNAM-1 (F) on fresh and induced γδ T cells in patient number five. The MFI of NKG2D (G) and DNAM-1 (H) on induced and fresh γδ T cells in six patients with MM. (**p < 0.01; ***p < 0.001).
